Client Portal: Bookings & Performance Page
Client Portal: Bookings & Performance
Performance
Overview
The Bookings & Performance page brings together details of occupancy and availability, with a new detailed view of your property's booking activity. It combines historical booking data, current reservations and future bookings to help you understand how your property is performing over time and what is currently booked in your calendar.
Information Tooltips
Throughout the Bookings & Performance page, you'll find information tooltips next to selected figures and headings. These tooltips provide additional detail about how figures are calculated, what information is included, and how specific sections of the page should be interpreted.
Performance Graph
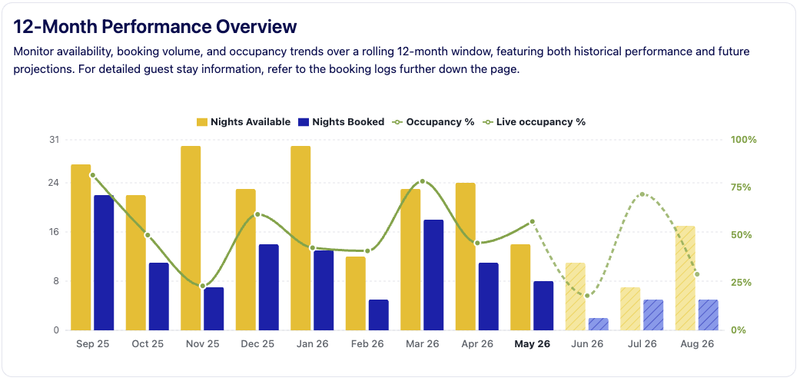
The 12-Month Performance Overview provides a rolling view of your property's availability, bookings and occupancy over a 12-month period.
The chart displays:
- Nights Available
- Nights Booked
- Occupancy %
The period covers
- Last 8 months
- Current month
- Next 3 months
Future months are displayed using lighter colours and a dotted occupancy line to indicate that booking activity may still change as new reservations are received or existing bookings are amended or cancelled. This view can help you identify seasonal trends, understand booking demand and monitor future occupancy.
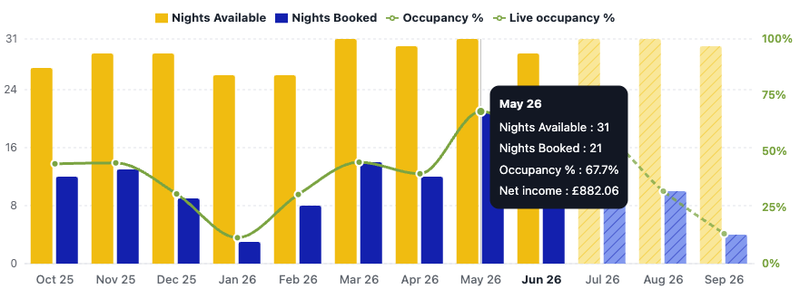
You can roll over the graph to see the exact figures for each month, including the net income.
On a mobile device, tap the month to make the pop up appear.
Bookings
Reporting Period
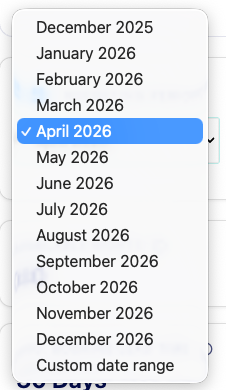
Use the Reporting Period selector to choose the month you would like to review in more detail. By default, the current month is displayed, but you can select any available month to view booking activity and performance metrics for that period.
You can also select a custom date range to view bookings for a bespoke period.
Key Performance Metrics
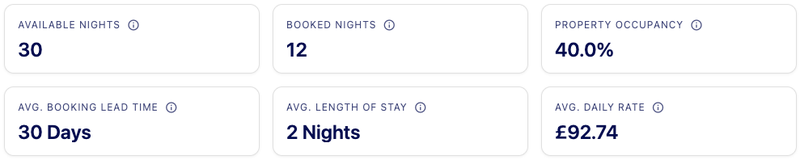
- Available Nights – The number of nights your property was available for guests to book
- Booked Nights – The number of nights booked by guests during the selected period
- Property Occupancy – The percentage of available nights that were booked
- Average Booking Lead Time – The average number of days between a booking being made and the guest arriving
- Average Length of Stay – The average duration of guest stays during the selected period
- Average Daily Rate – The average nightly rate achieved across bookings during the selected period
NB: Home owner stays are excluded from these figures.
Bookings for the Selected Period
Below the summary metrics you'll find a detailed list of bookings that fall within the selected reporting period. The page displays future, current, completed and cancelled bookings. Each booking can be expanded to display additional information.
Understanding Booking Information
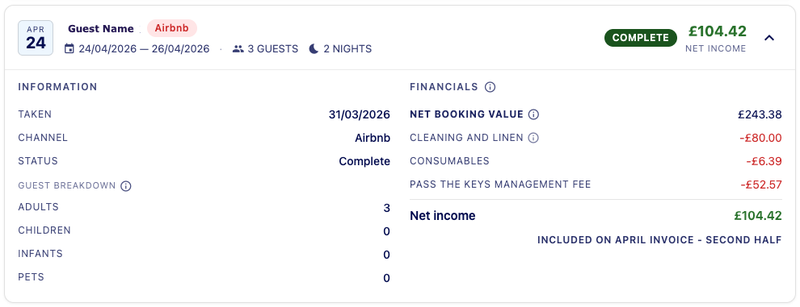
Each booking contains information about the guest, booking channel, booking dates, booking status, guest numbers and length of stay. Guest information may also include adults, children, infants and pets where available.
Guest information
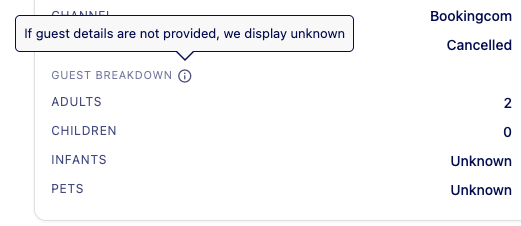
Where provided, we display the number and breakdown of guest mix. If this data isn’t provided by the booking platform we will display unknown
Booking Financial Information
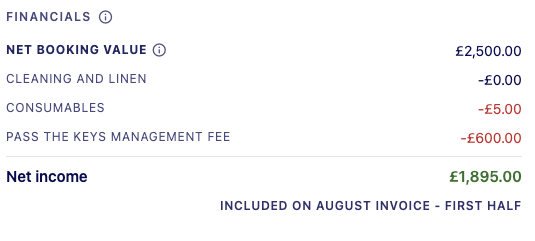
Each booking includes a financial summary showing Net Booking Value, Cleaning & Linen, Consumables, Management Fee and Net Income.
This provides a clear breakdown of how booking income is calculated. For a more detailed financial view, the Accounting page displays details about the income and expenses by month, cost type and channel booking mix.
Included on Invoice Label
To make it easy to understand which invoice a booking will appear on, weave introduced a new ‘Included on Invoice’ label. This shows you which invoice the booking will appear on and help when tracking payments.
Night Breakdown
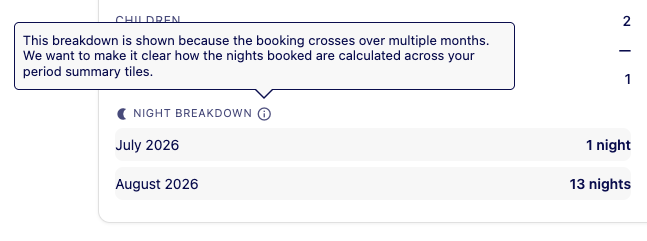
For bookings that span multiple months, an additional Night Breakdown section is displayed. This shows how many nights fall within each month.
Frequently Asked Questions
Bookings & Performance page FAQs
For a quick view, we’ve included the net income figure in the tool tip on the performance graph.
To see net income for a different period, you can see this on the accounting page. Select the period ar select a custom date range and the net income is displayed as a total & monthly breakdown
The summary cards only include nights that fall within the selected reporting period.
If a guest stay spans multiple months, the booking will appear when viewing each relevant month. The nights are allocated to the month in which they occur, ensuring occupancy and performance figures are accurately reported for each reporting period.
Available Nights are nights your property was available to book. Booked Nights are nights reserved by guests.